2022 | Cobli
Field Services
Cobli is an end-to-end fleet tracking solution. This is about how I helped build its Field Services product.


The team
01 Product Designer [me]
02 Product Managers
08 Engineers
[All team members were based in Brazil]
I've used the Double Diamond Theory as a basis, understanding that design frameworks aren't linear and don’t guarantee results. As the only Product Designer in the squad, I led the end-to-end design process.
Results
+ *,108
Routes created
32%
Adoption Rate
"Perfect and beneficial"
- Eletro Univese [user]

Field Services at a glance
Cobli is a fleet management solution that analyzes IoT data, providing visibility, security, and control of physical operations. I was part of the team responsible for developing its Field Service product.
The goal was to boost fleet productivity with GPS tracking and dispatching, protect their drivers, and keep end customers informed.
Understanding users
The Product Manager and I interviewed over 30 fleet managers across various sectors using Google Meets. Our findings revealed two significant insights:
Specific Use Case Limitations
The existing route planner feature in Cobli was tailored for a particular scenario, rendering it impractical for most of our customers.Preference for Manual Planning
Users desired to plan their routes manually rather than rely on automated optimization.
Furthering our research, I connected with five drivers through WhatsApp. These conversations brought to light two critical aspects of the driver experience:
The primacy of Map View:
For drivers, reaching the customer is crucial, and the map emerged as the most vital tool in navigating to their destinations.Importance of Estimated Time of Arrival (ETA)
ETA was highlighted as a critical feature, helping drivers align with the expectations of fleet managers and plan their routes more efficiently.


I also delved into existing user research and sought feedback through Slack. This provided a solid foundation for constructing a CSD Matrix. Key insights were:
Certainties
We knew which data concerned users.Suppositions
How can the product boost users productivity?Doubts
How fleet managers responded to unforeseen events?
It was now time to examine how industry leaders like Samsara, OnFleet, and Keep Trucking enhance their field services experience. My investigation revolved around:
What are the input requirements for route creation?
Are there visual design patterns for route display? What criteria determine the optimized paths?
What capabilities are offered to app users?

Me, the Product Manager and the Tech Lead crafted over 30 job stories, balancing technical feasibility, product goals, and user needs. The "dotmocracy" method was employed to narrowing the job stories down to ten.
Following this, we launched a Typeform survey to understand which job stories resonated most with users. Within a week, 80 responses poured in, revealing two critical insights: a strong preference for real-time, individualized data, and an interest in the comparison of planned versus executed routes.

Flow & architecture
At this stage, I learned the hard way that developing user flows before the visual design is crucial, a lesson I shared in my Medium article, "Não deixe o fluxo para trás" (pt-br).
Revisiting our approach, I created user flows for the MVP and final product, clarifying our goals and feasible actions within our timeline.
Collaborating with the Engineering and Product teams, we defined the MVP requirements:
MVP Essentials: Enable the fleet manager to assign the right driver to the appropriate route with complete visibility of service details.
Exclusions: Avoid implementing recurring routes initially due to technical complexities.
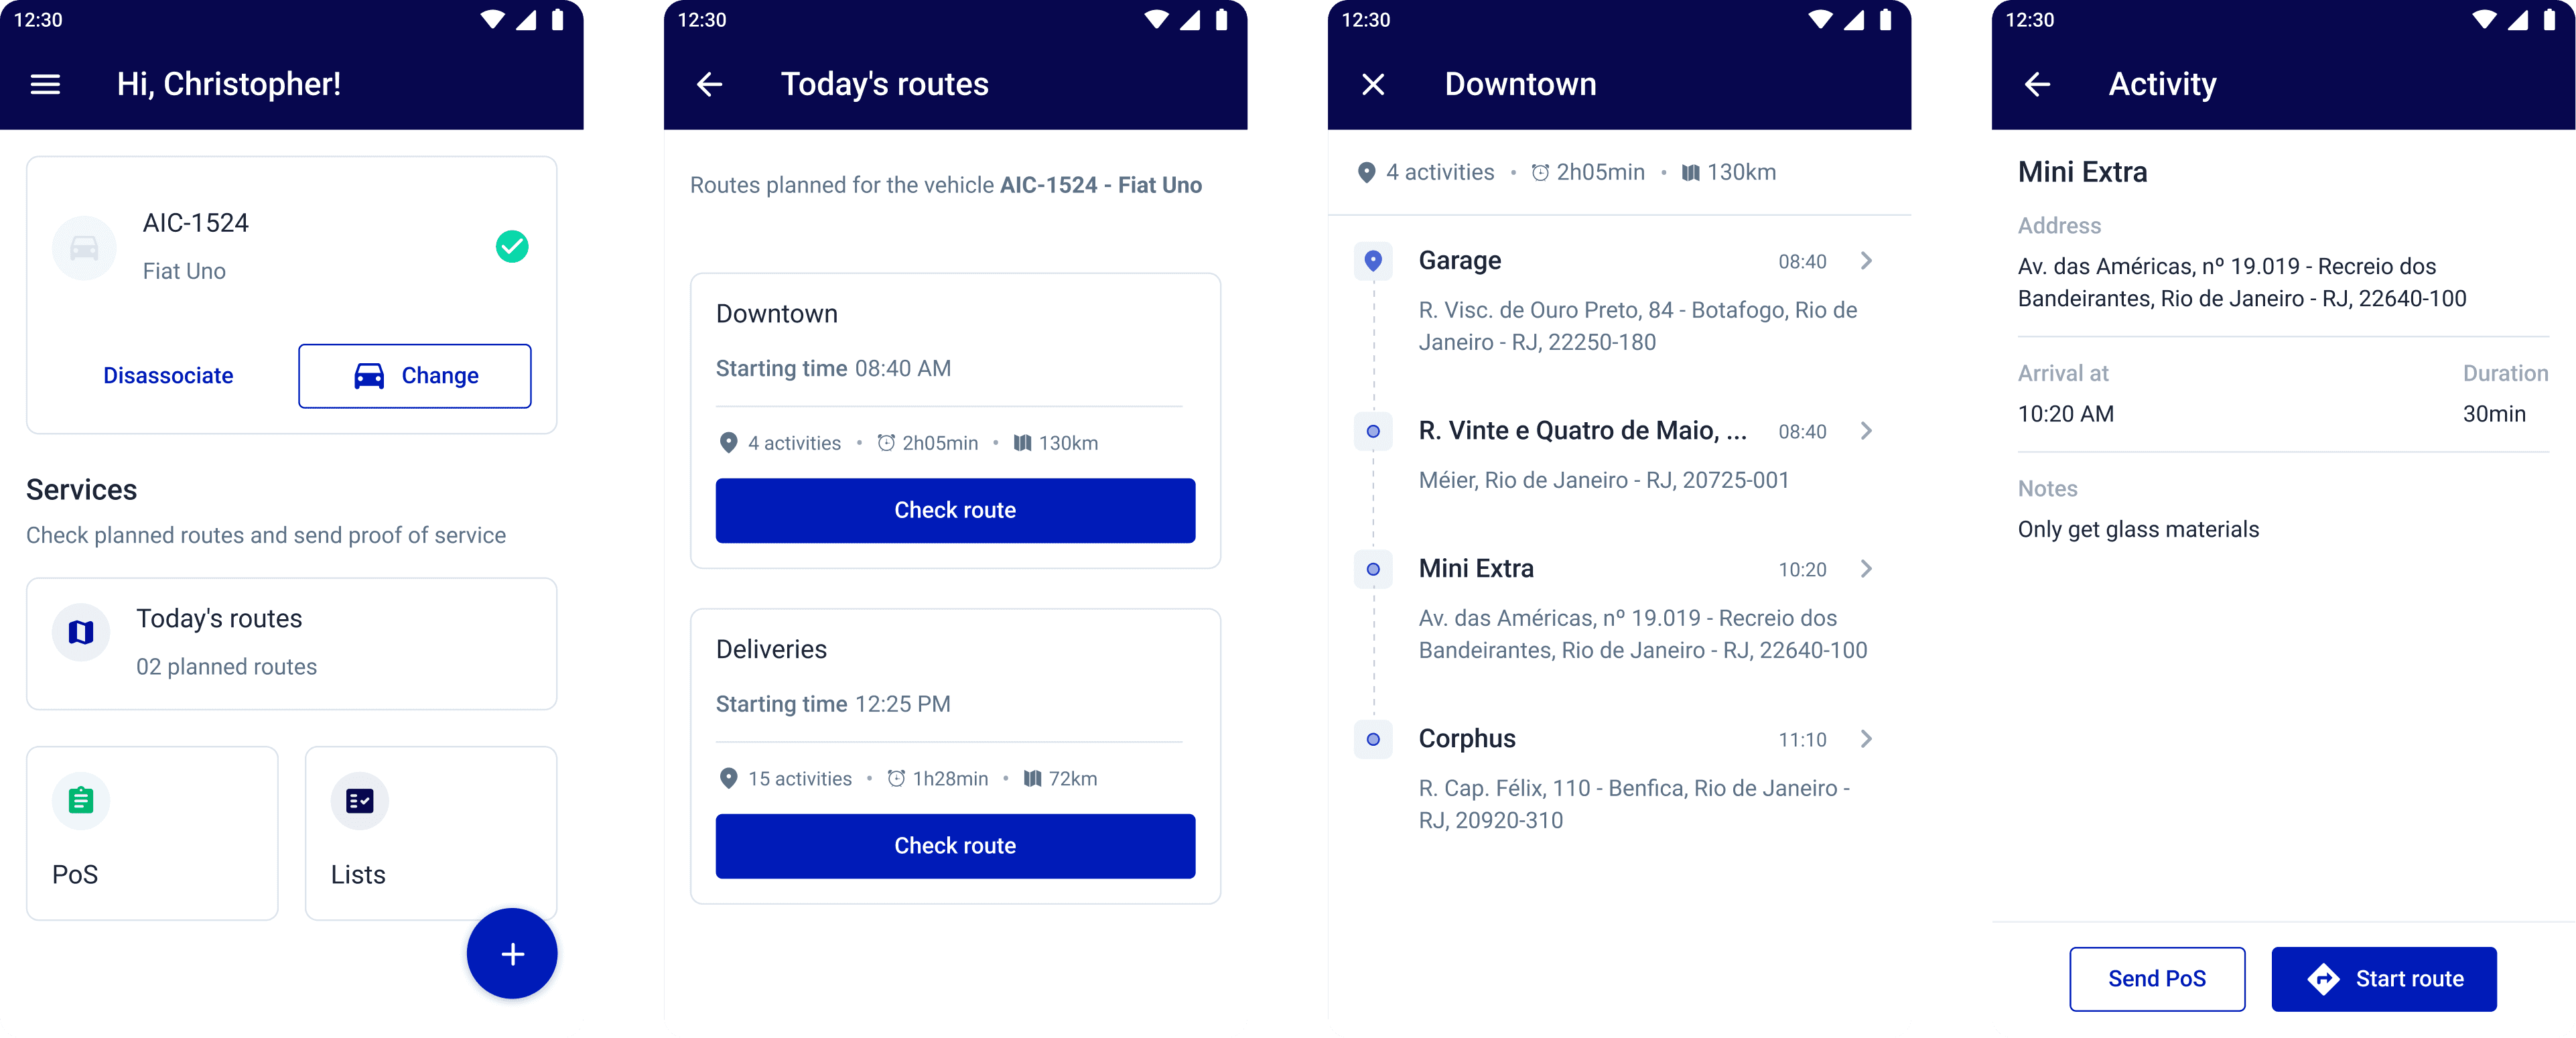
For route management:
In-progress Routes: Users can view them in list or map formats. The list view will show the route's name, progress, associated vehicle, and execution date.
Planned Routes: Users can delete, assign a vehicle, and view details.
Wireframing the solution
I created wireframes in Figma to shape the project and establish its visual hierarchy.
Next, I solicited feedback from the Engineering, Design, and Product teams. We focused on the product structure, deliberately avoiding distractions like colors and images. Outcomes included:
Architecture
Route's type is what dictates information required from users.Use Cases
I developed two route viewer proposals - one separating daily routes from others and another categorizing routes as past, present, or future. This clarified the job stories for each scenario.Dashboard <> App Integration
The product should prompt the fleet manager to assign a vehicle to each route to boost Driver's App usage.

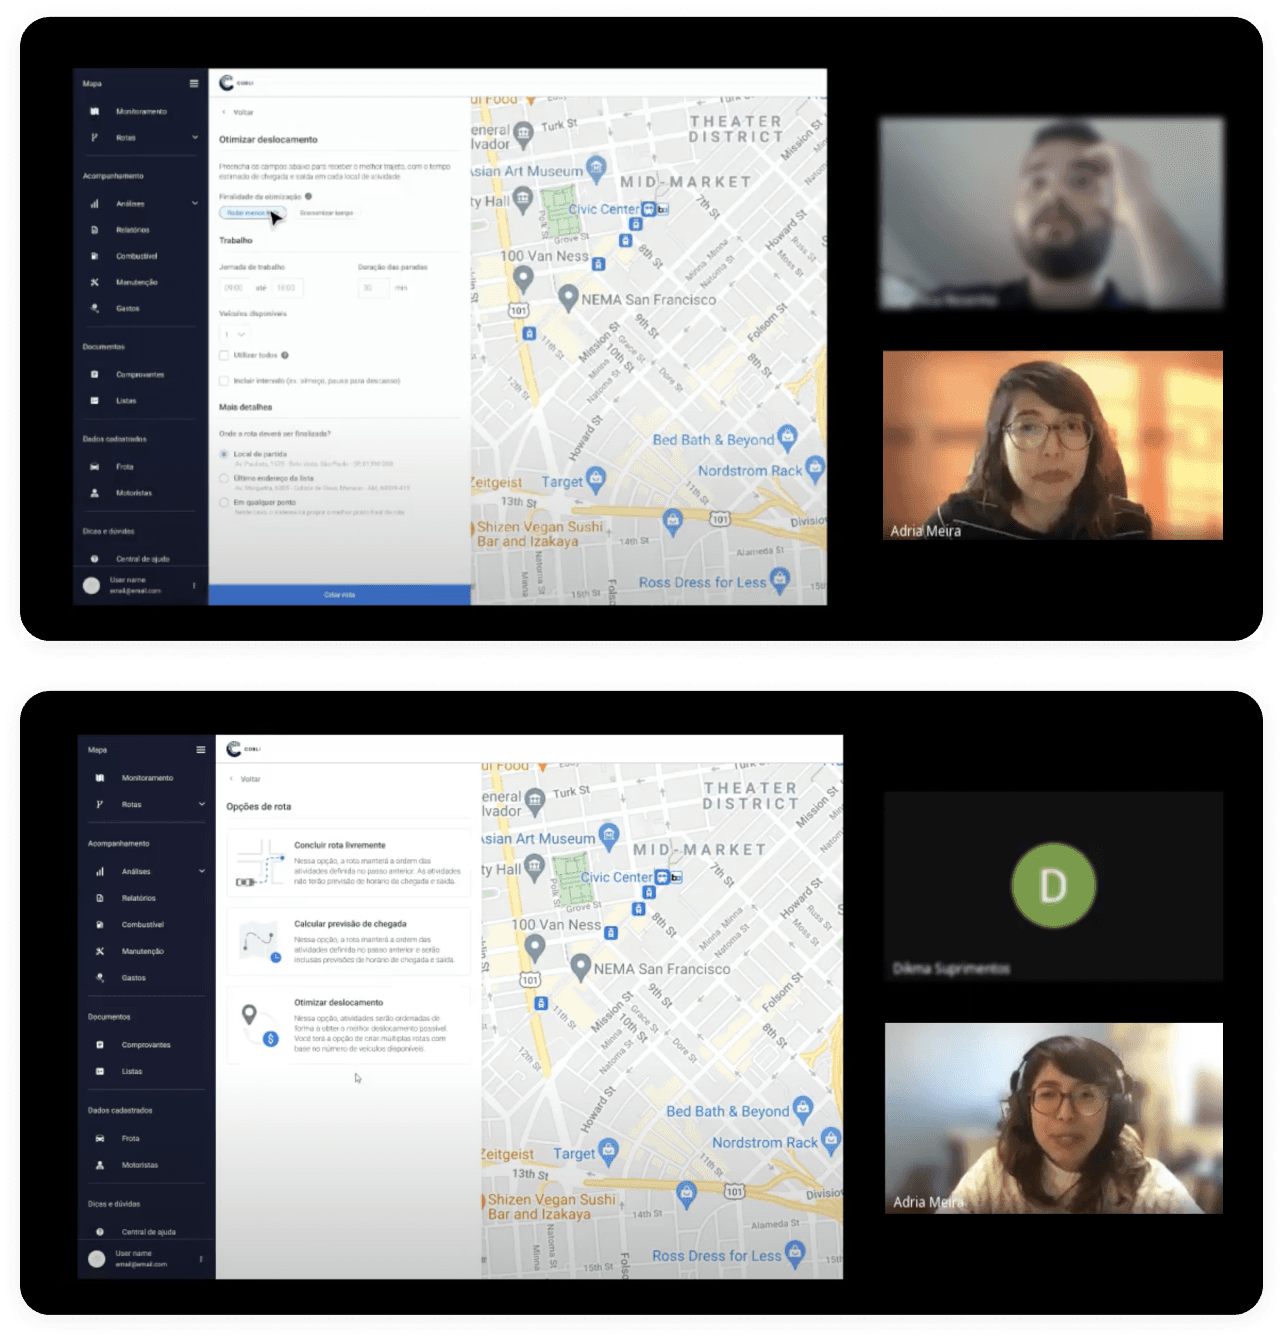
Validating the Design
I conducted three rounds of usability testing sessions, talking to 15+ users to validate whether the designs would solve their problems.
During the session via Google Meets, I observed how they interacted with the prototype. It helped me understand what was going wrong and what we needed to change. Some of the learning was:
Visual Design: Date picker over tabs
Users prefer a date picker when checking for their routes instead of having a tab for each moment (present, future, past)
Content Design: "Delayed" and "Planned"
These route statuses needed to be clarified for all (!) of the participants
After analyzing the results, I got to redesign the screens. Then, I used Maze to run three more usability tests with +50 users in just a few days.
Handoff, QA & Metrics
Upon completing the designs, I prepared the documentation for the engineering team to develop the product. This smooth handoff was achieved due to several factors, such as:
Effective Communication
Product, Design and Engineering was always in touch - whether by design reviews, Slack channels, or Figma comments.
Collaborative Development
The solution was crafted with members from all teams considering challenges and feedback throughout the process.
Additionally, I worked closely with the Product Manager to create a list of Mixpanel events and metrics. This allowed us to monitor user behavior and analyze the product's performance and success.


Next steps
User Interaction Insights
Observing initial user interactions with the product revealed critical areas for improvement, notably in map view comparisons and route start time adjustments.
Feature Development Backlog
Continuous research efforts contributed to a feature backlog for the non-MVP version of the product, including spreadsheet import and route editing features.
Takeaways
Get to know your user
For the first time at the company, a designer conducted research and usability sessions with drivers, the secondary user group. This approach led to insights for enhancing Driver's App adoption.
… and your teammates
Getting to know your co-workers as real people can impacts project development and team dynamics.
Nothing great is built alone
Whether you're brimming with ideas or just seeking a new friend, feel free to connect!


